The intelligence behind intelligent decisions
Unparalleled understanding of how money is moving and why
EPFR provides a deeper view of the market to show where money is moving across geographies, sectors, industries and securities, enabling the global investment community to make intelligent decisions based on solid facts.
Our best-in-class Fund Flows and Allocations Data helps you reveal the investible truth by looking at market trends, investor sentiment, liquidity, risk signals and corporate actions, and can be tailored to your specific use case.
$54T+
93%
151K+
$7T+
25+
Primary benefits
Industry-leading timeliness and granularity
Supports both bottom-up and top-down asset allocation strategies
Illustrated analysis of key factors driving current flow trends
Critical insights at macro and stock levels
Unique views on fund manager and investor sentiment
Insight into the fixed Income fund market at a bond ownership and security level
Personalized,
consultative approach
Data tailored for your unique strategy
Our experts work with you 1-on-1 to assess your use case and ensure that you are getting the best inputs and most actionable insights for your needs.
EPFR is a global company built on service and helping the investment community gain a deeper understanding of what’s really happening.

Trusted by:
%
of the Bulge Bracket (the world’s largest investment banks)
%
of the “top 20” global asset management firms (by AUM)
%
of the Bulge Bracket (the world’s largest central banks)
%
of the “top 20” global asset mgmt firms (by AUM)
Latest Insights
Thought leadership and analysis that help you find a signal in the noise
Investors feel the squeeze in early April
There were some unwelcome additions to the “higher for longer” list during the first week of April as geopolitical risks and energy prices joined US interest rates on the tally sheet. Fears that Iran will become directly involved in Israel’s war with Hamas in Gaza and Ukraine’s drone campaign against Russian refineries pushed oil prices towards a six-month high.
Market Insights: GEM Ex-China
Join us for our 20-min Market Insight call on GEM Ex-China, hosted by EPFR’s Research team; Cameron Brandt, Steven X. Shen, CQF and Kirsten Longbottom.
Corporate America’s trillion dollar put
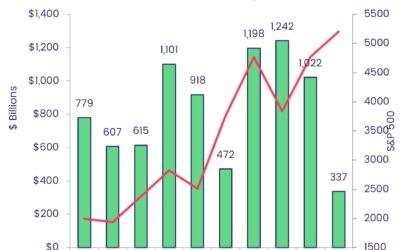
Last year, US companies spent over $1 trillion buying back their own shares. It was the third consecutive year in which repurchases topped the $1 trillion threshold, and fourth time in the last six years.
Equity Research Webinar
After a decade where a rising tide of liquidity lifted most equity markets, analyzing this asset class has rapidly become more complicated ats the Covid pandemic, Russia’s attack on Ukraine, rising inflation and tighter monetary policy have roiled global asset markets. In a 35-minute webinar on April 18, key members of EPFR’s research team will use the company’s datasets to illustrate how these factors are playing out at the geographic, asset class and single security levels.


