
The intelligence behind intelligent decisions
Unparalleled understanding of how money is moving and why
EPFR provides a deeper view of the market to show where money is moving across geographies, sectors, industries and securities, enabling the global investment community to make intelligent decisions based on solid facts.
Our best-in-class Fund Flows and Allocations Data helps you reveal the investible truth by looking at market trends, investor sentiment, liquidity, risk signals and corporate actions, and can be tailored to your specific use case.
$54T+
93%
151K+
$7T+
25+
Primary benefits
Industry-leading timeliness and granularity
Supports both bottom-up and top-down asset allocation strategies
Illustrated analysis of key factors driving current flow trends
Critical insights at macro and stock levels
Unique views on fund manager and investor sentiment
Insight into the fixed Income fund market at a bond ownership and security level
Personalized,
consultative approach
Data tailored for your unique strategy
Our experts work with you 1-on-1 to assess your use case and ensure that you are getting the best inputs and most actionable insights for your needs.
EPFR is a global company built on service and helping the investment community gain a deeper understanding of what’s really happening.

Trusted by:
%
of the Bulge Bracket (the world’s largest investment banks)
%
of the “top 20” global asset management firms (by AUM)
%
of the Bulge Bracket (the world’s largest central banks)
%
of the “top 20” global asset mgmt firms (by AUM)
Our data and insights are highly cited in


Latest Insights
Thought leadership and analysis that help you find a signal in the noise
Sell in May and go away until 2025?
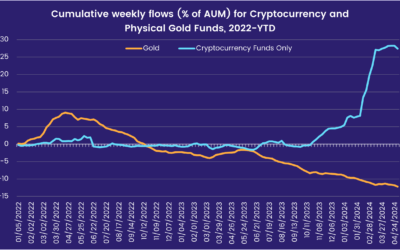
The final week of April ended with US markets closing the books on their worst month since September, the price of Bitcoin down some 17% from its mid-March high, Russia on the offensive in Ukraine and US interest rate cuts nowhere in sight. Against this backdrop, flows to most EPFR-tracked fund groups remained subdued for the second week running.

EPFR in the news – April 2024
Here is the March 2024 summary of where EPFR’s Fund Flows and Allocations data is cited in leading media outlets globally.
Hoped-for US rate cuts morph into fear of another hike
Investors took a cautious approach to most asset classes during the third week of April, with lackluster inflows or modest outflows being the norm for many EPFR-tracked fund groups. Japan Equity and Mortgage-Backed Bond Funds were notable exceptions.
Sell in May and go away until 2025?
The final week of April ended with US markets closing the books on their worst month since September, the price of Bitcoin down some 17% from its mid-March high, Russia on the offensive in Ukraine and US interest rate cuts nowhere in sight. Against this backdrop, flows to most EPFR-tracked fund groups remained subdued for the second week running.
EPFR in the news – April 2024
Here is the March 2024 summary of where EPFR’s Fund Flows and Allocations data is cited in leading media outlets globally.
Hoped-for US rate cuts morph into fear of another hike
Investors took a cautious approach to most asset classes during the third week of April, with lackluster inflows or modest outflows being the norm for many EPFR-tracked fund groups. Japan Equity and Mortgage-Backed Bond Funds were notable exceptions.
The cruelest month shows its colors
April is known for its showers, warming trends and sudden changes in climate. This April, it has been missiles and attack drones that made up the showers, prices that have stayed warm and the investment climate that has shifted abruptly.